



Price: on request
Baseline
For a structured entry with baseline analysis and conversation.
- Baseline analysis
- Clinically reviewed interpretation
- Personal plan as starting point
Scroll narrative from the closed blood draw through the sample to the digital twin on your devices. With reduced motion or without WebGL, eight quiet chapter images with the same text are shown.
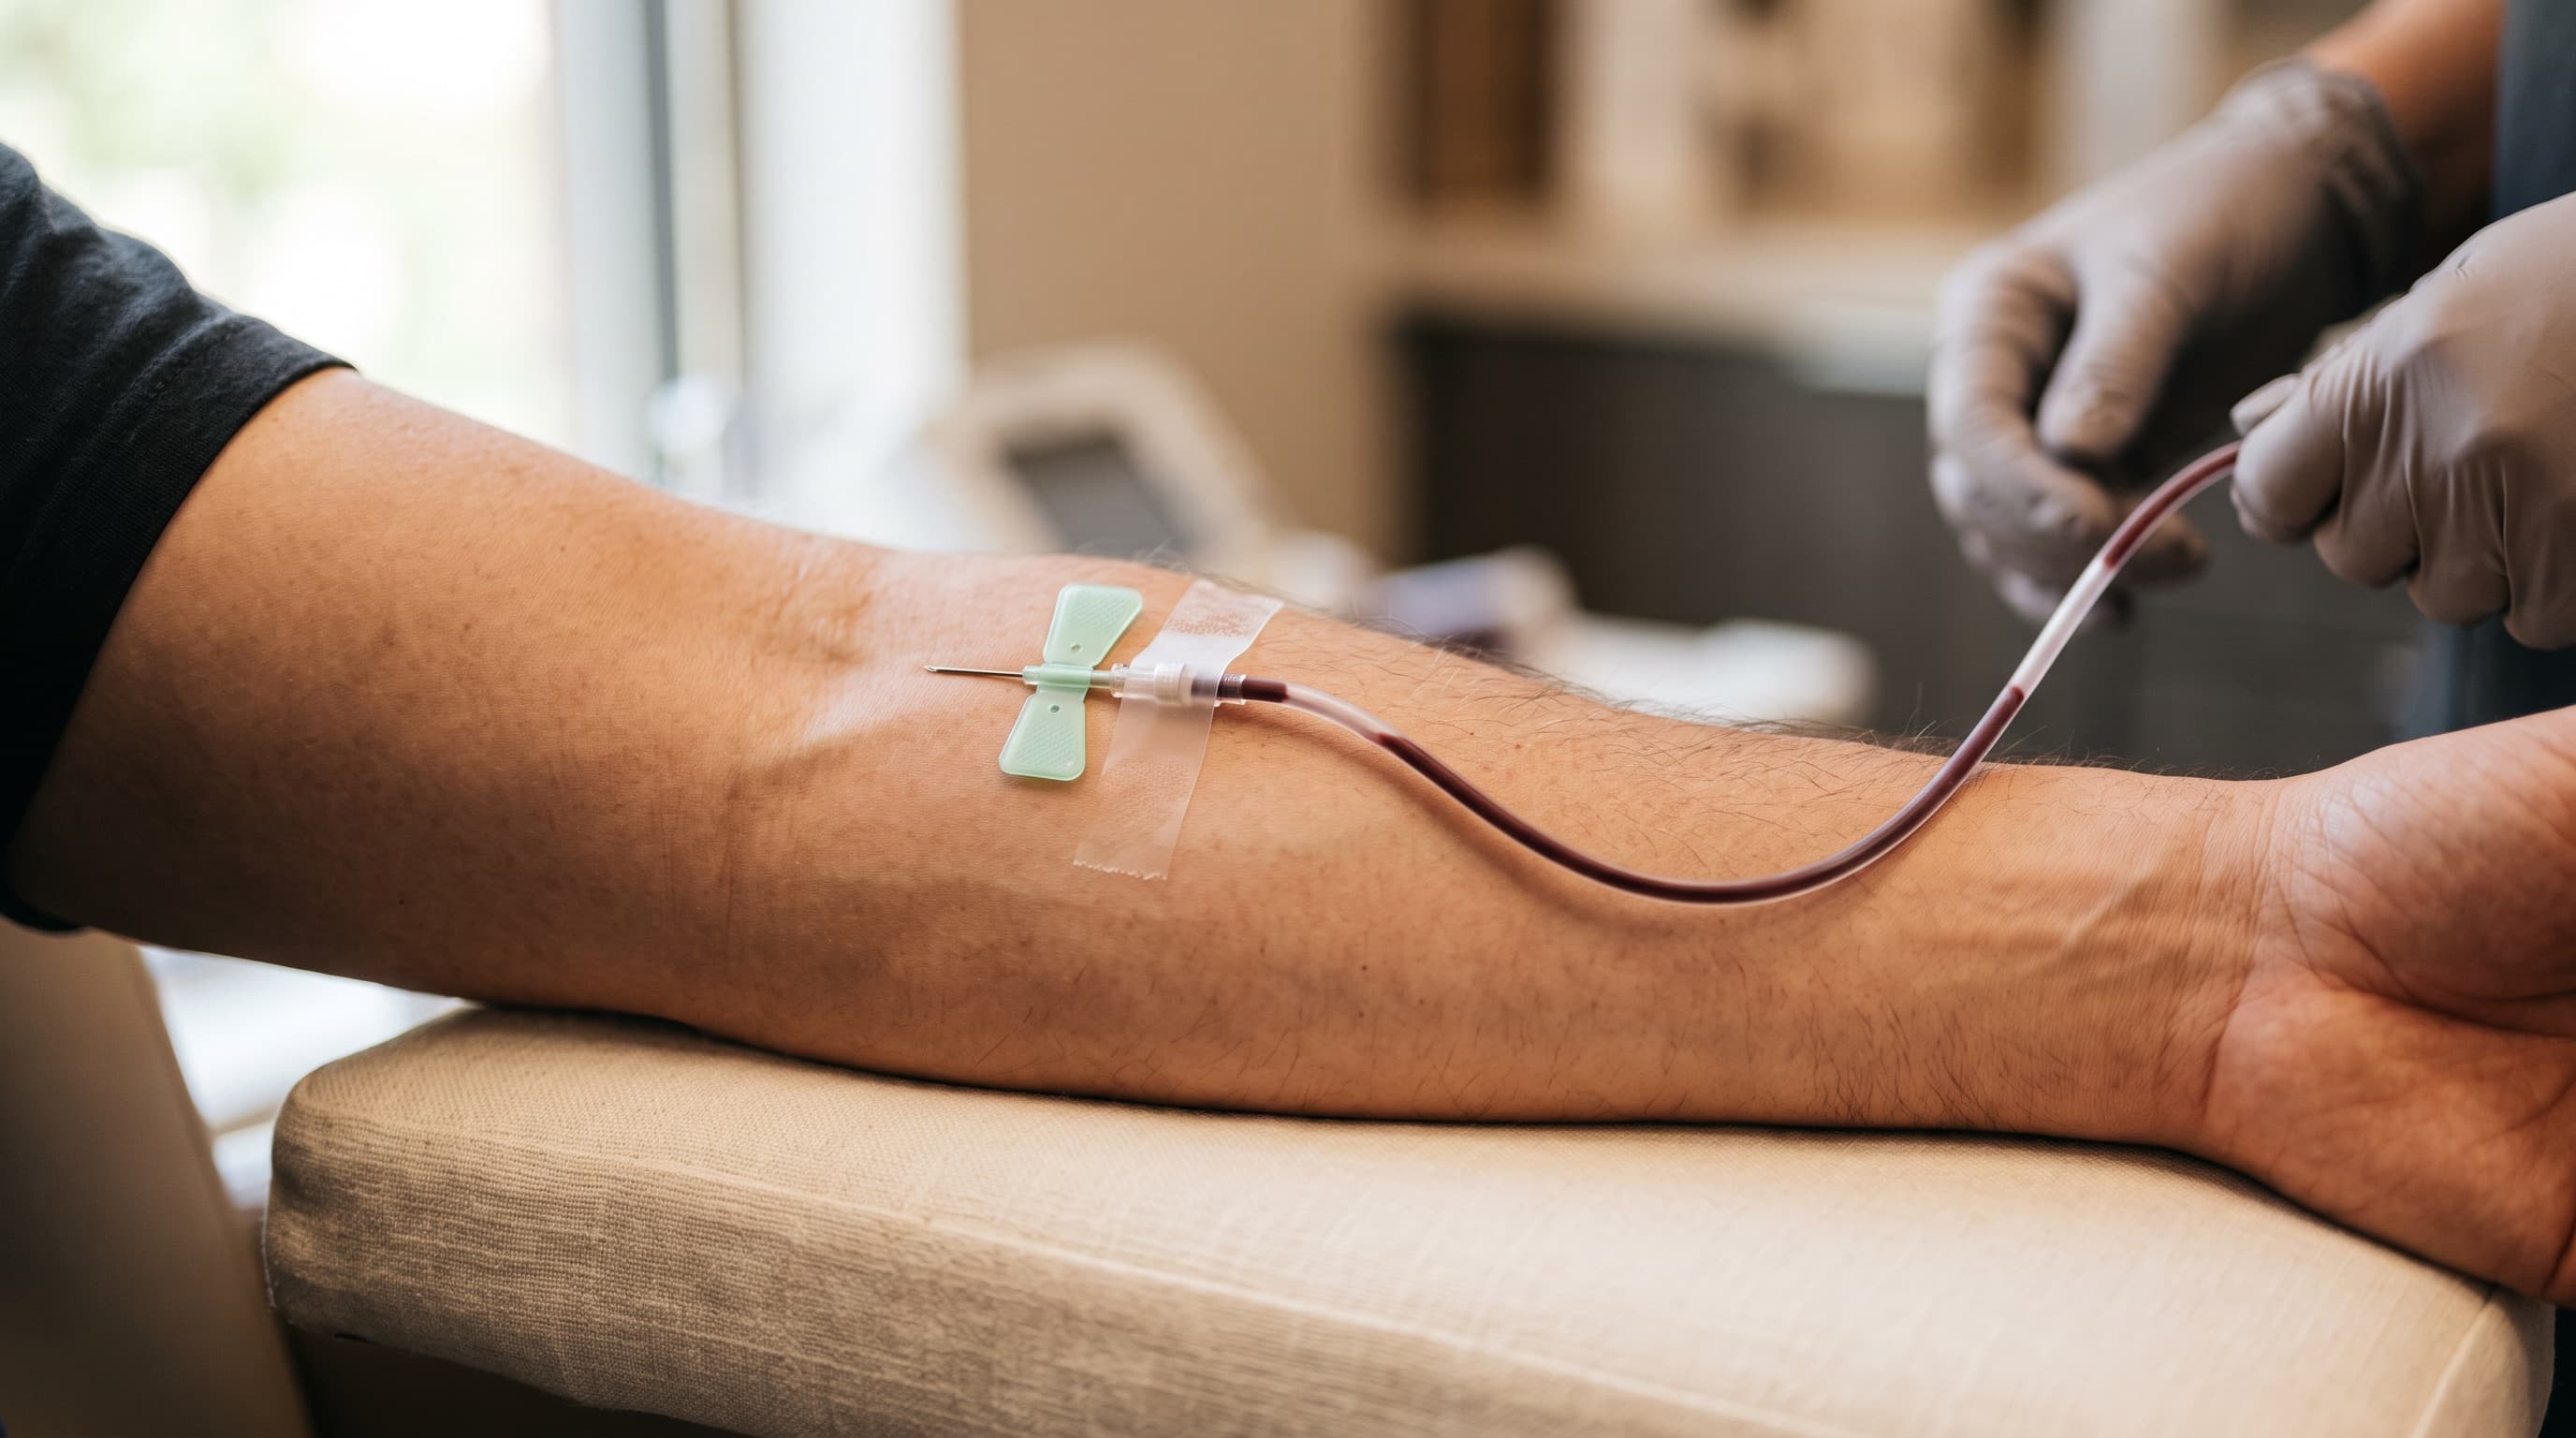
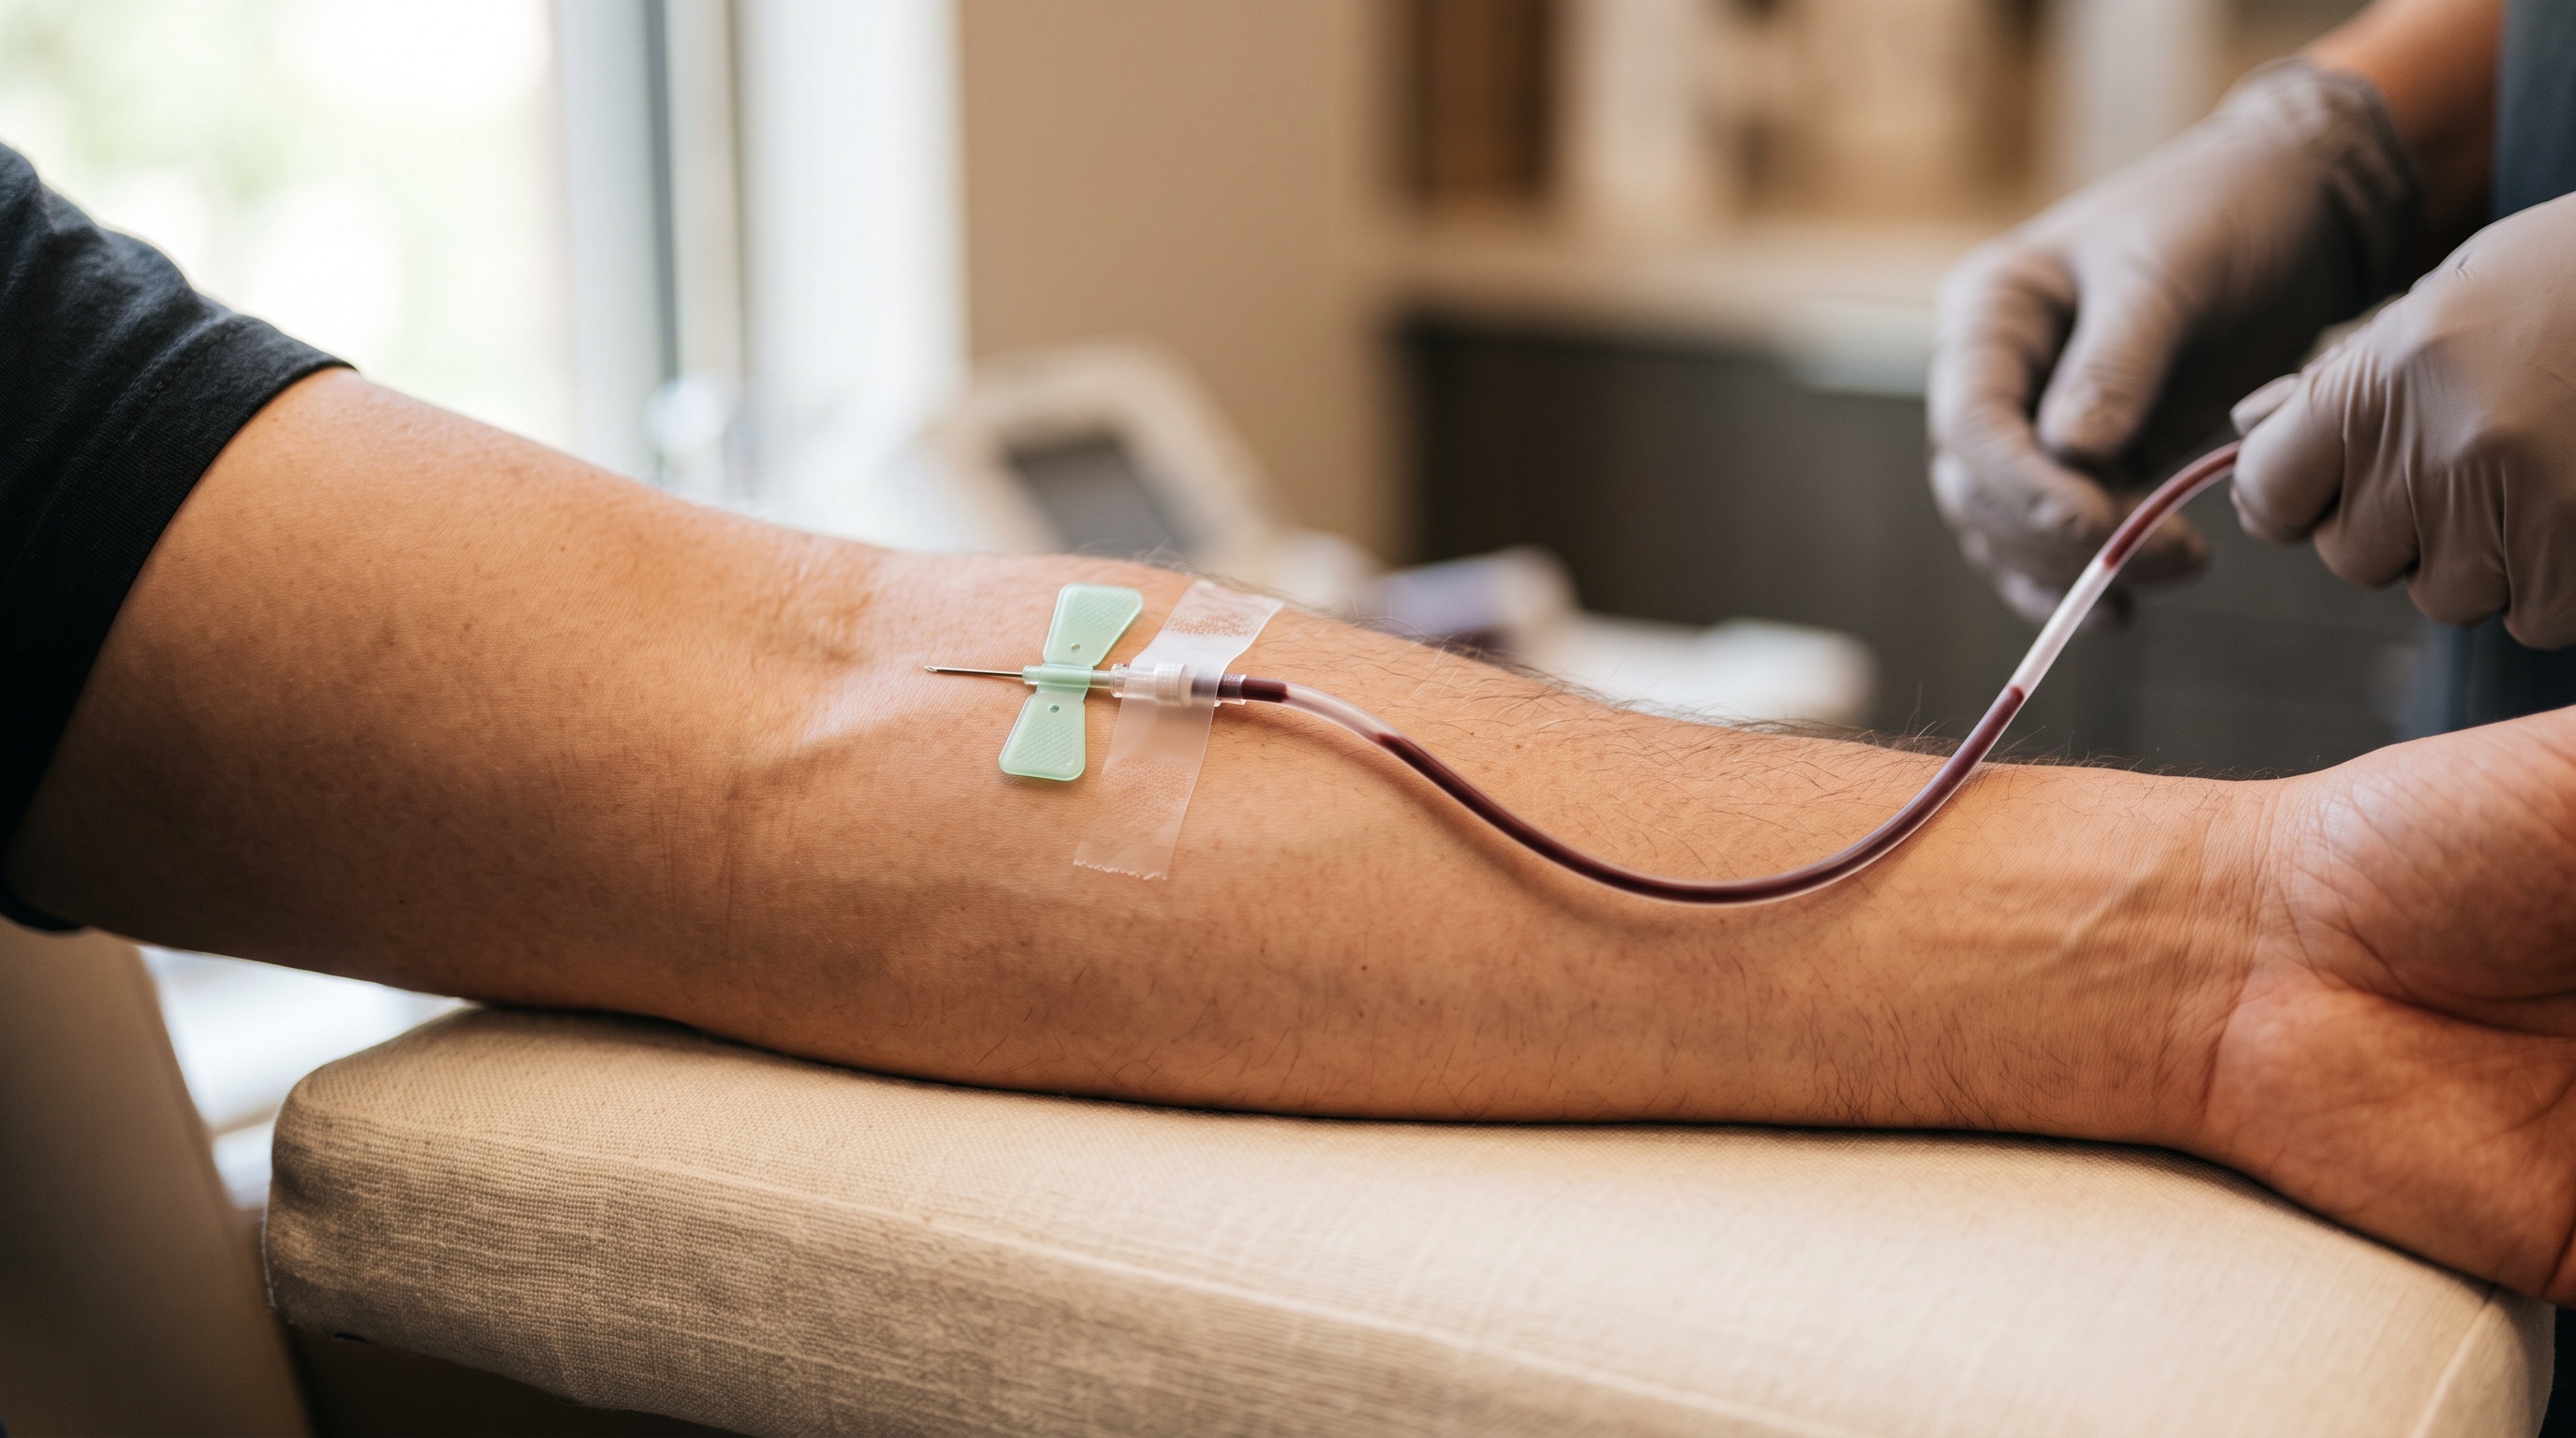
The sample begins in a calm, closed process at the wrist. From the start, it remains clear where the material comes from and how it is carried onward.
The fluid front follows the tubing in a controlled way, without showing blood outside the system.
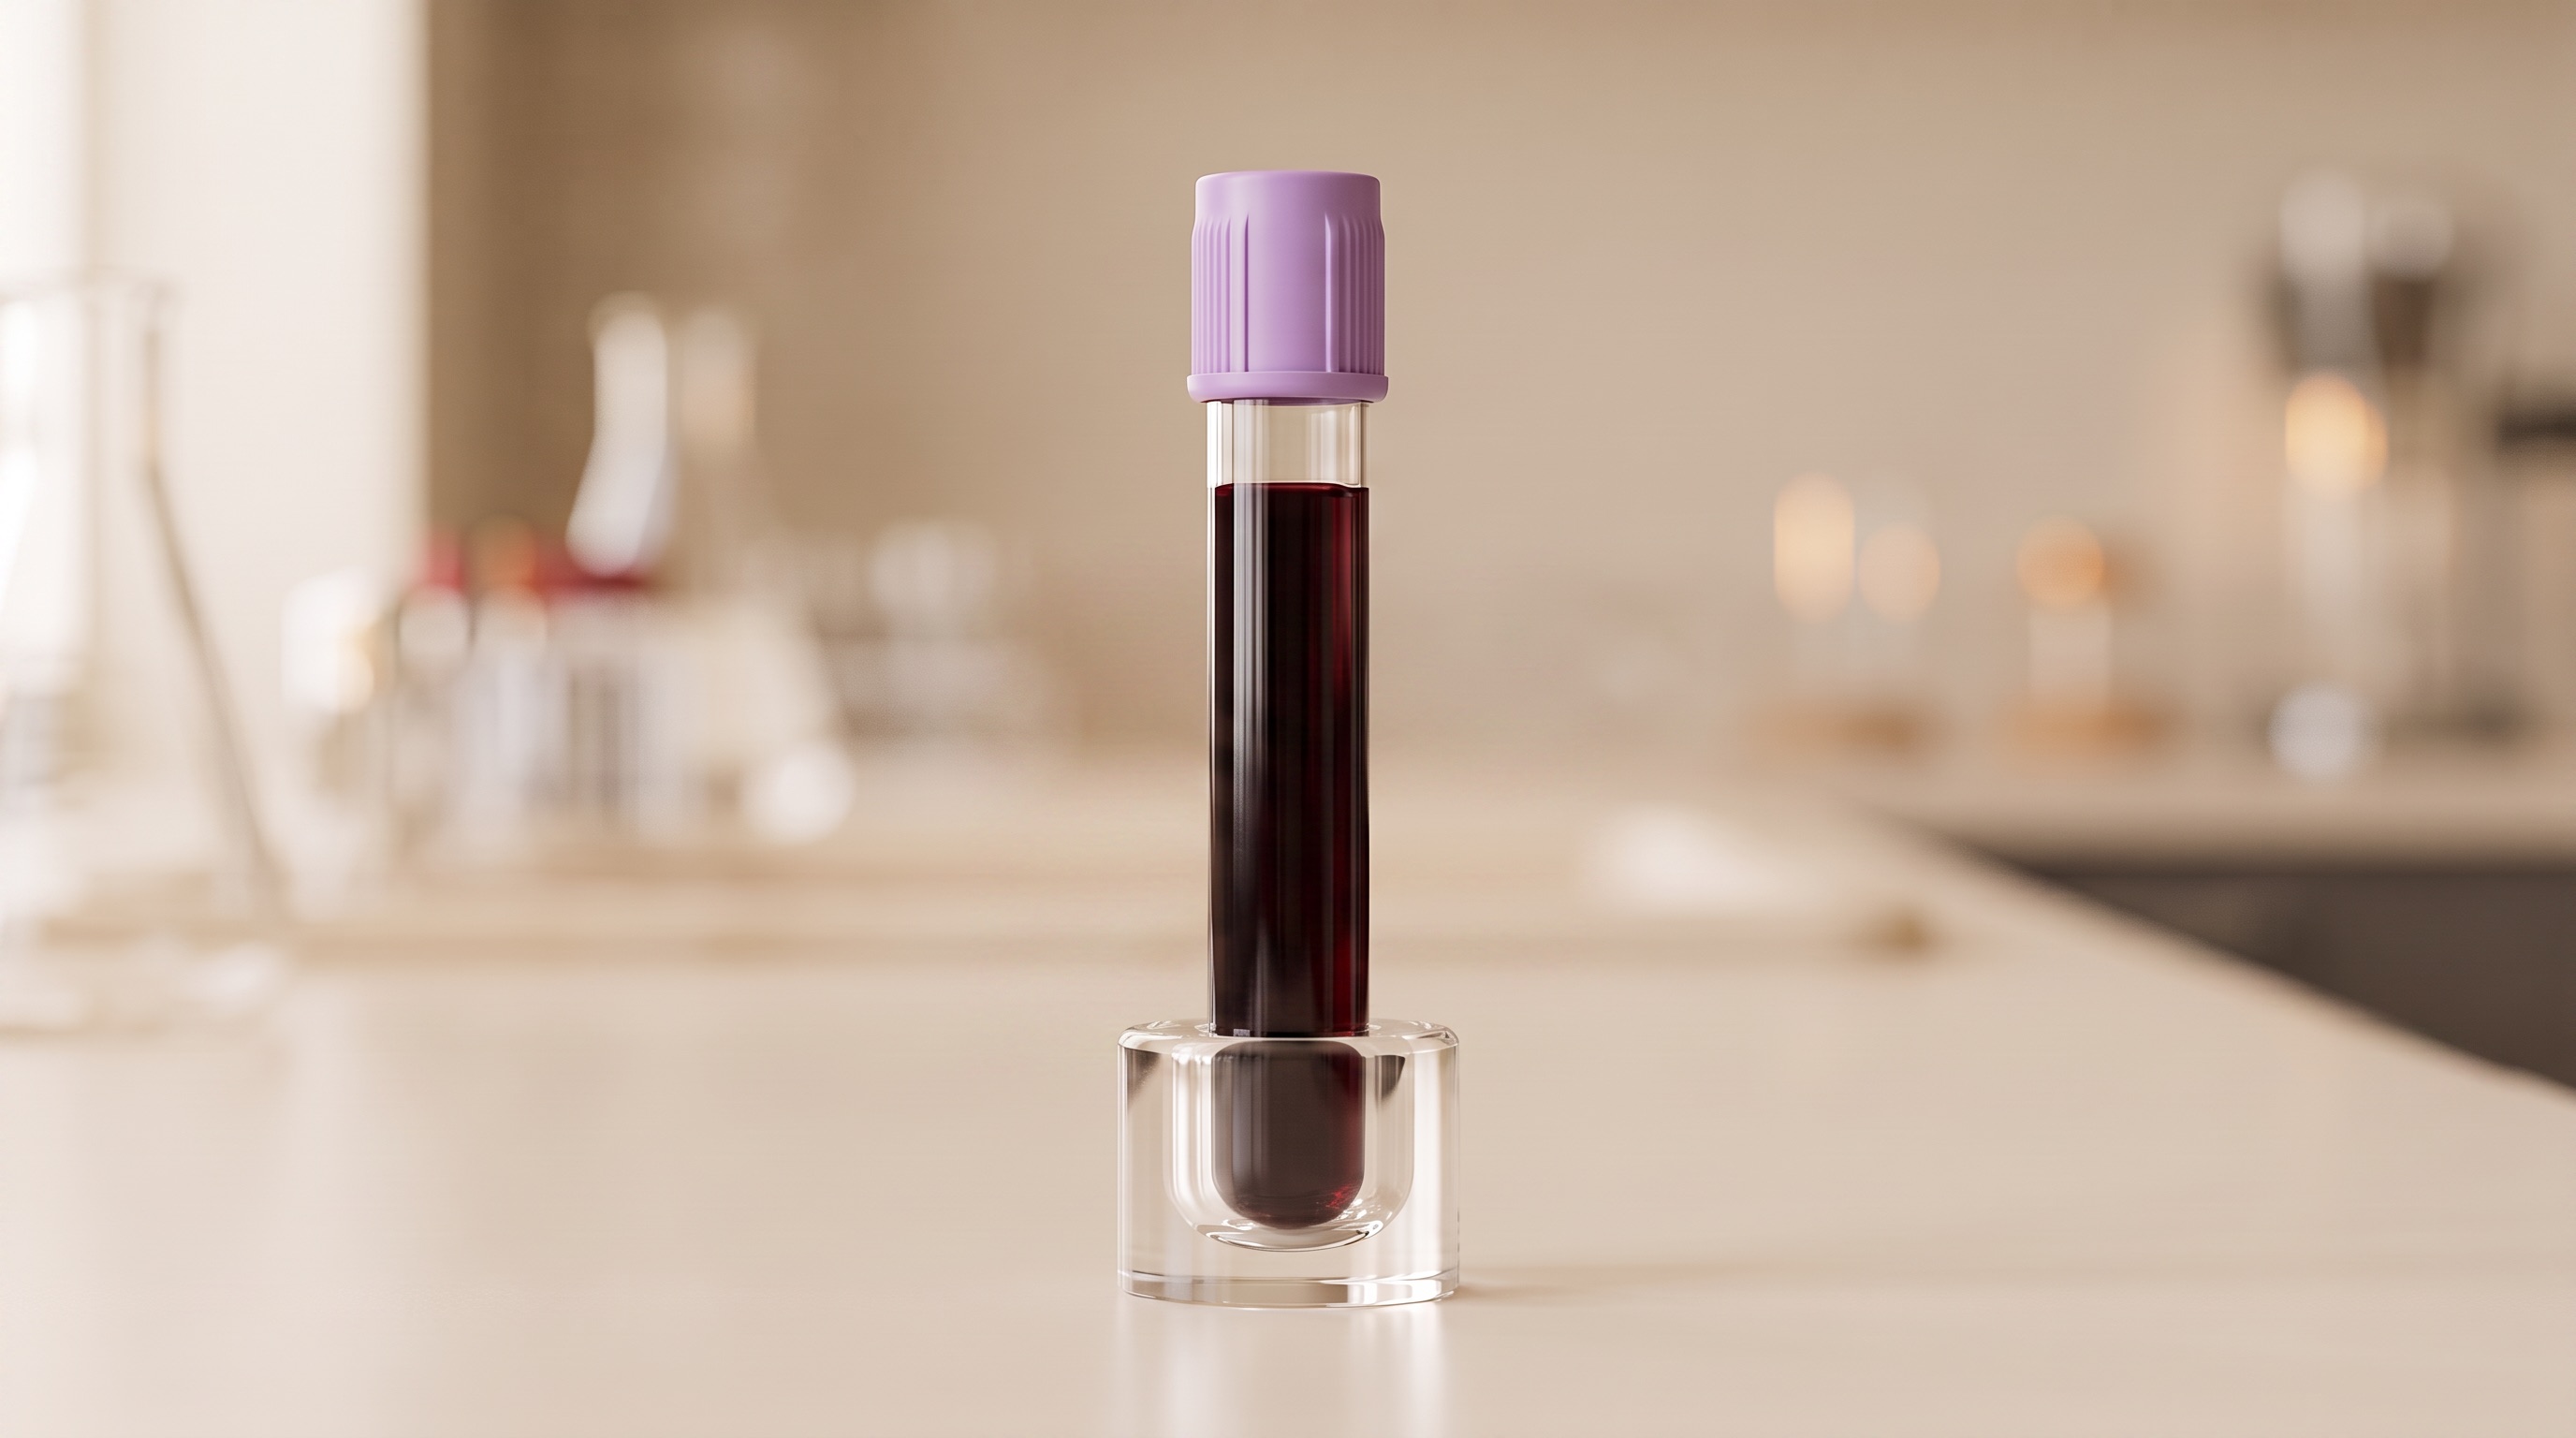
The EDTA tube fills from the bottom. An air space remains visible.
The camera approaches the sample calmly and prepares the transition into the microscopic layer.
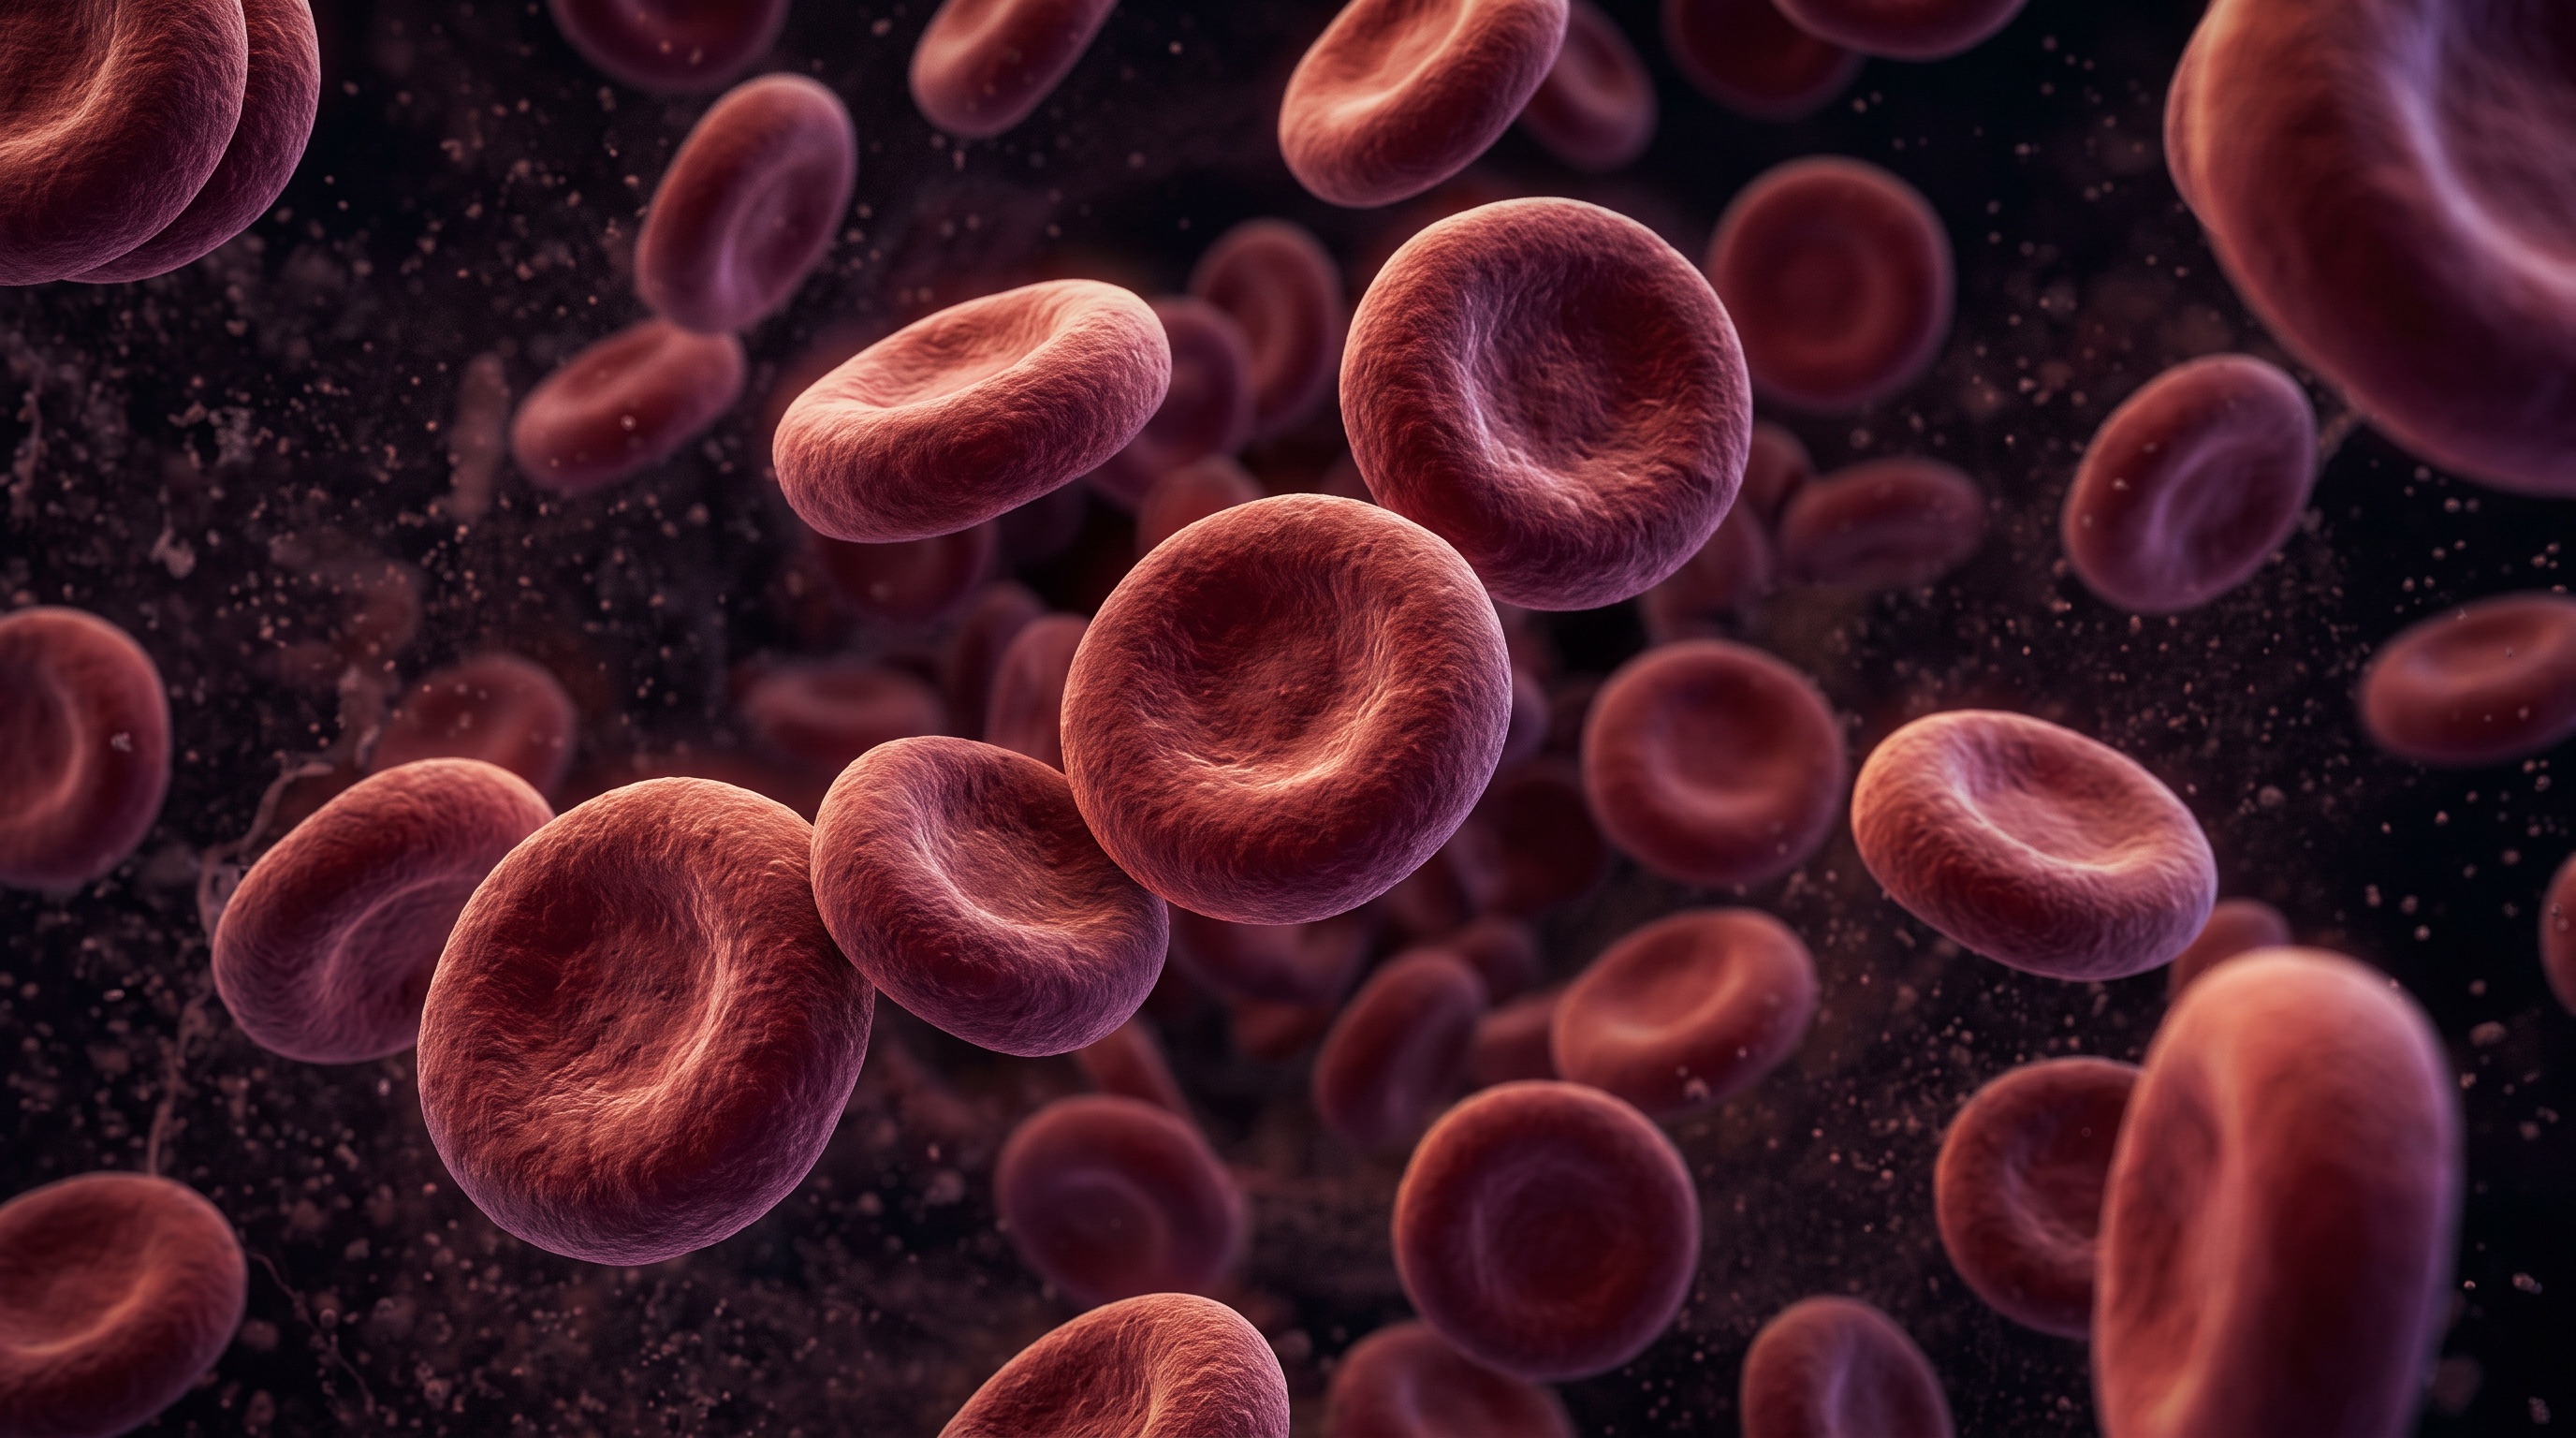
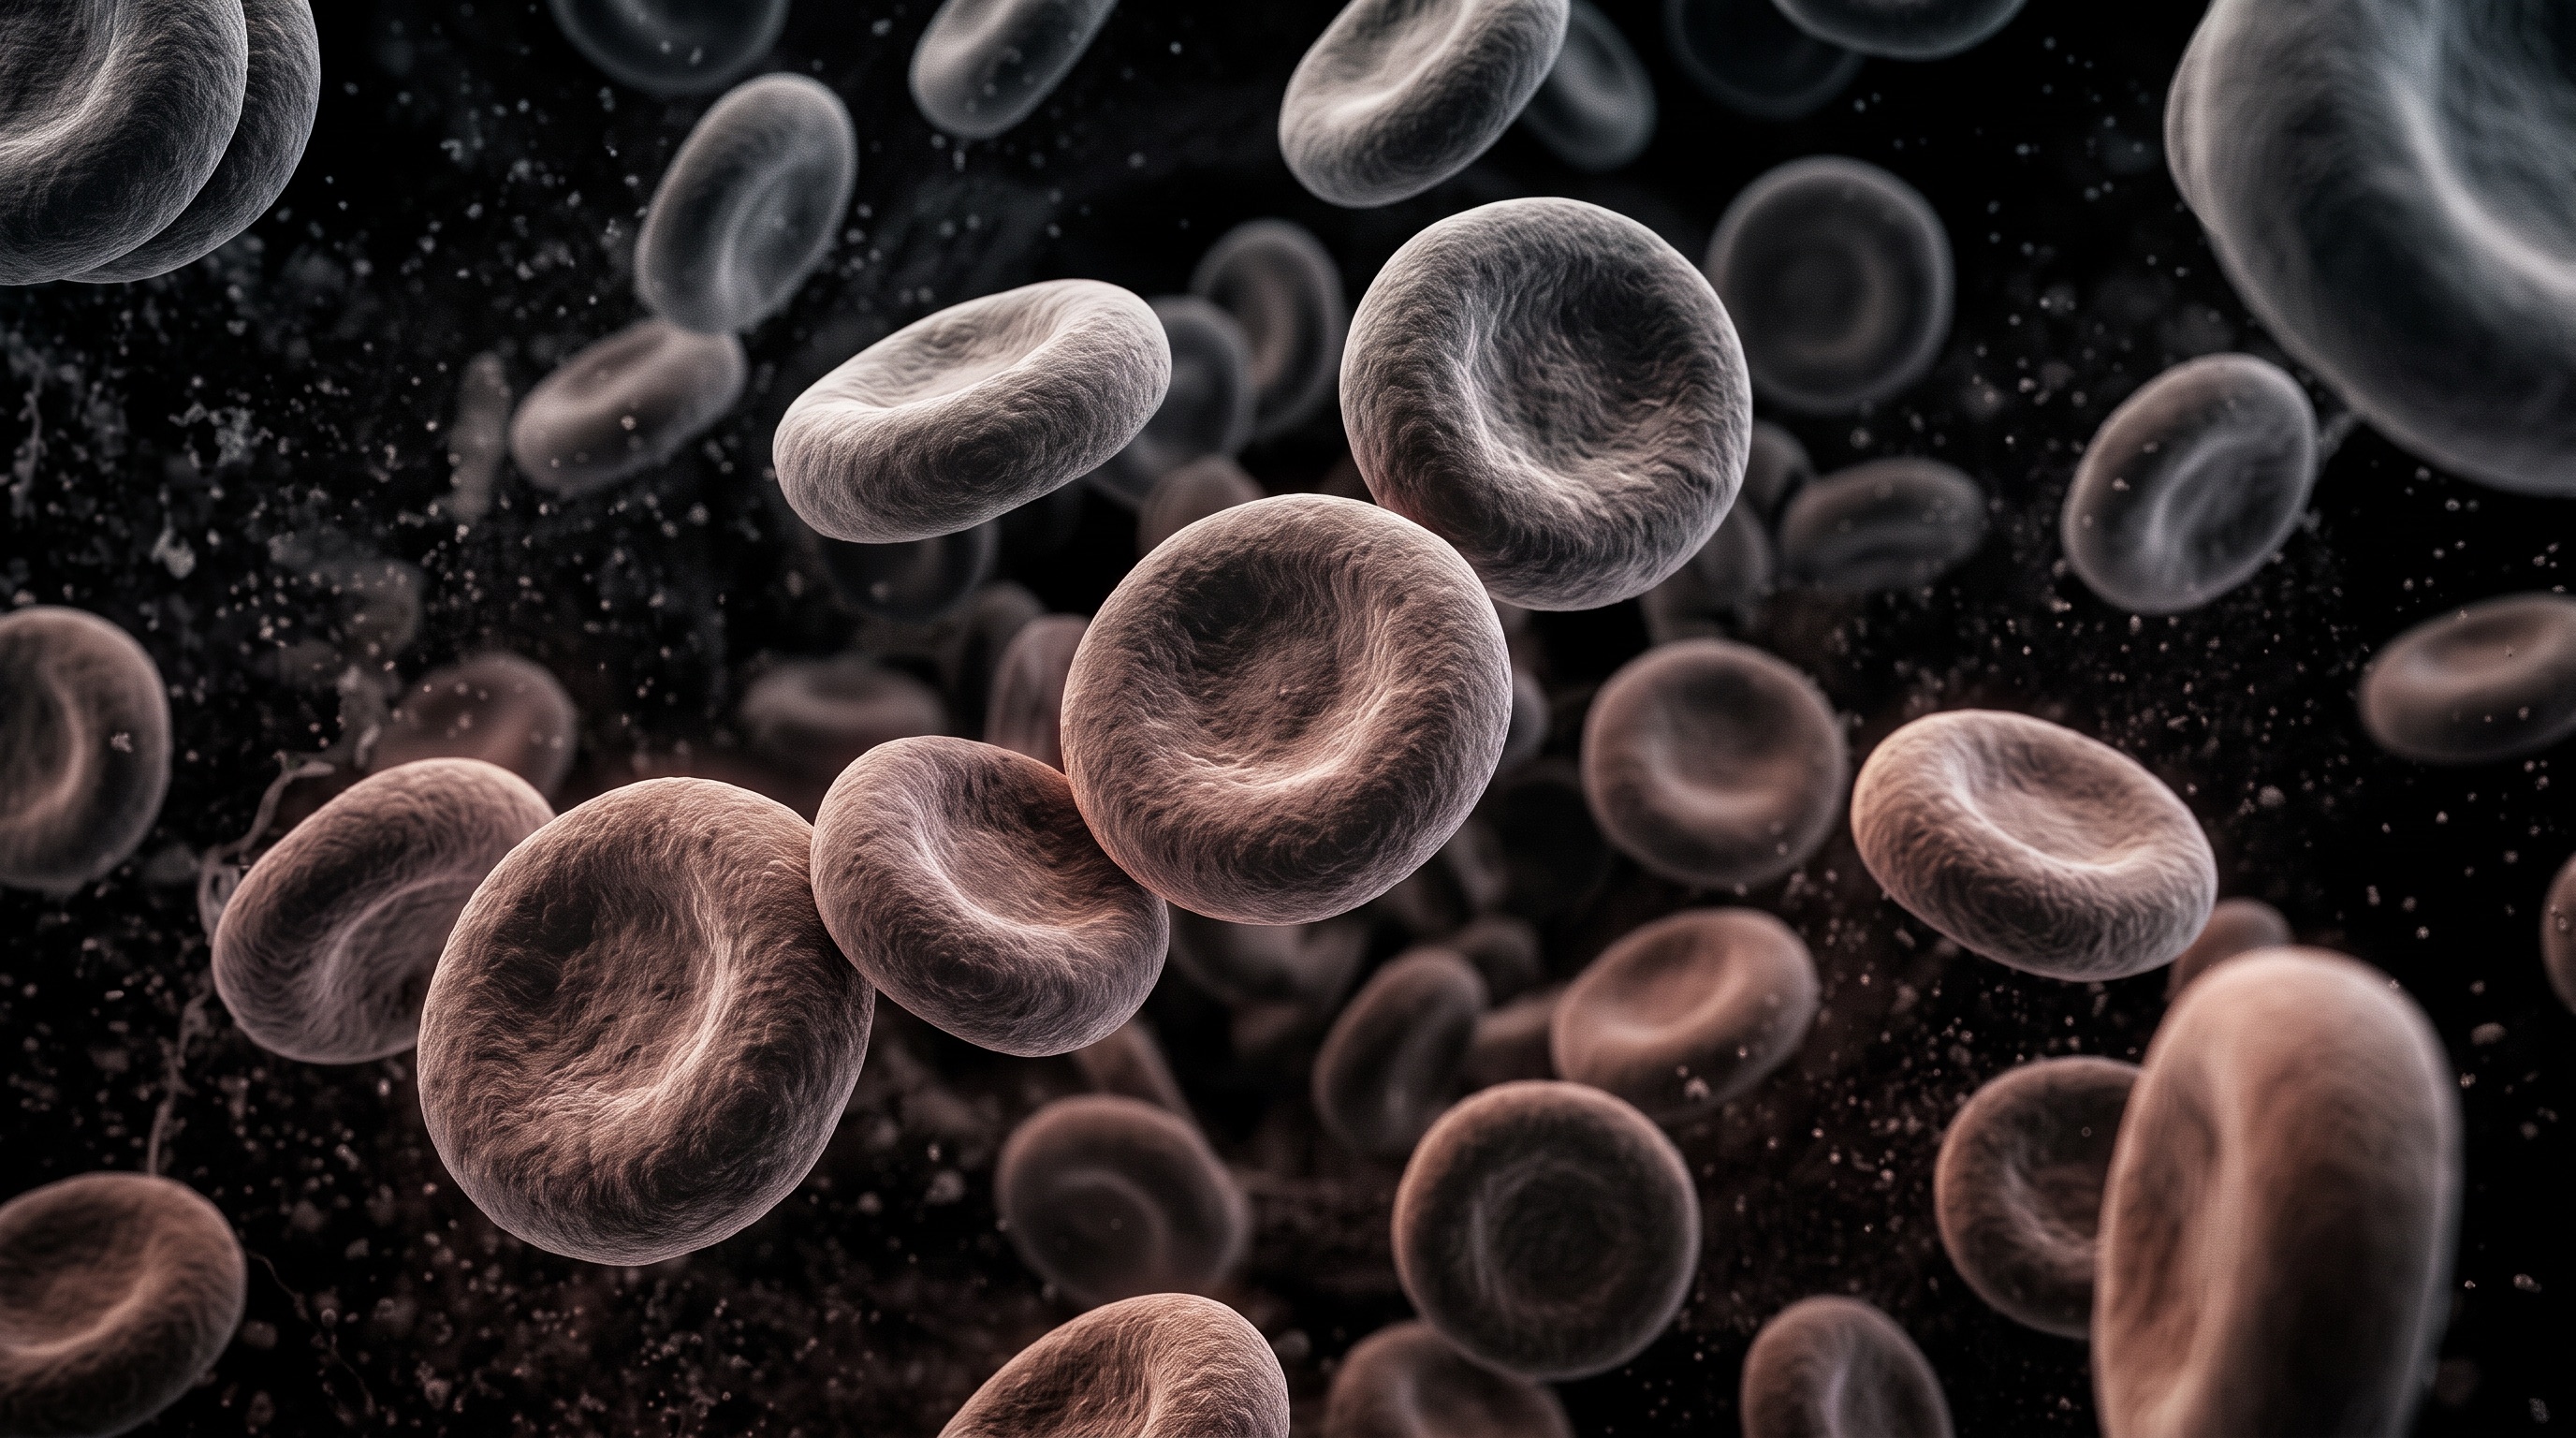
At the electron microscope layer, color recedes. The cell surface and its form become traceable.
Hemoglobin and heme groups stand for measurable molecular relationships within the sample.
Molecular relationships become structured code — the basis for the Digital Health Twin from our sister brand Juvantis. The synthesis begins with synthetic data.
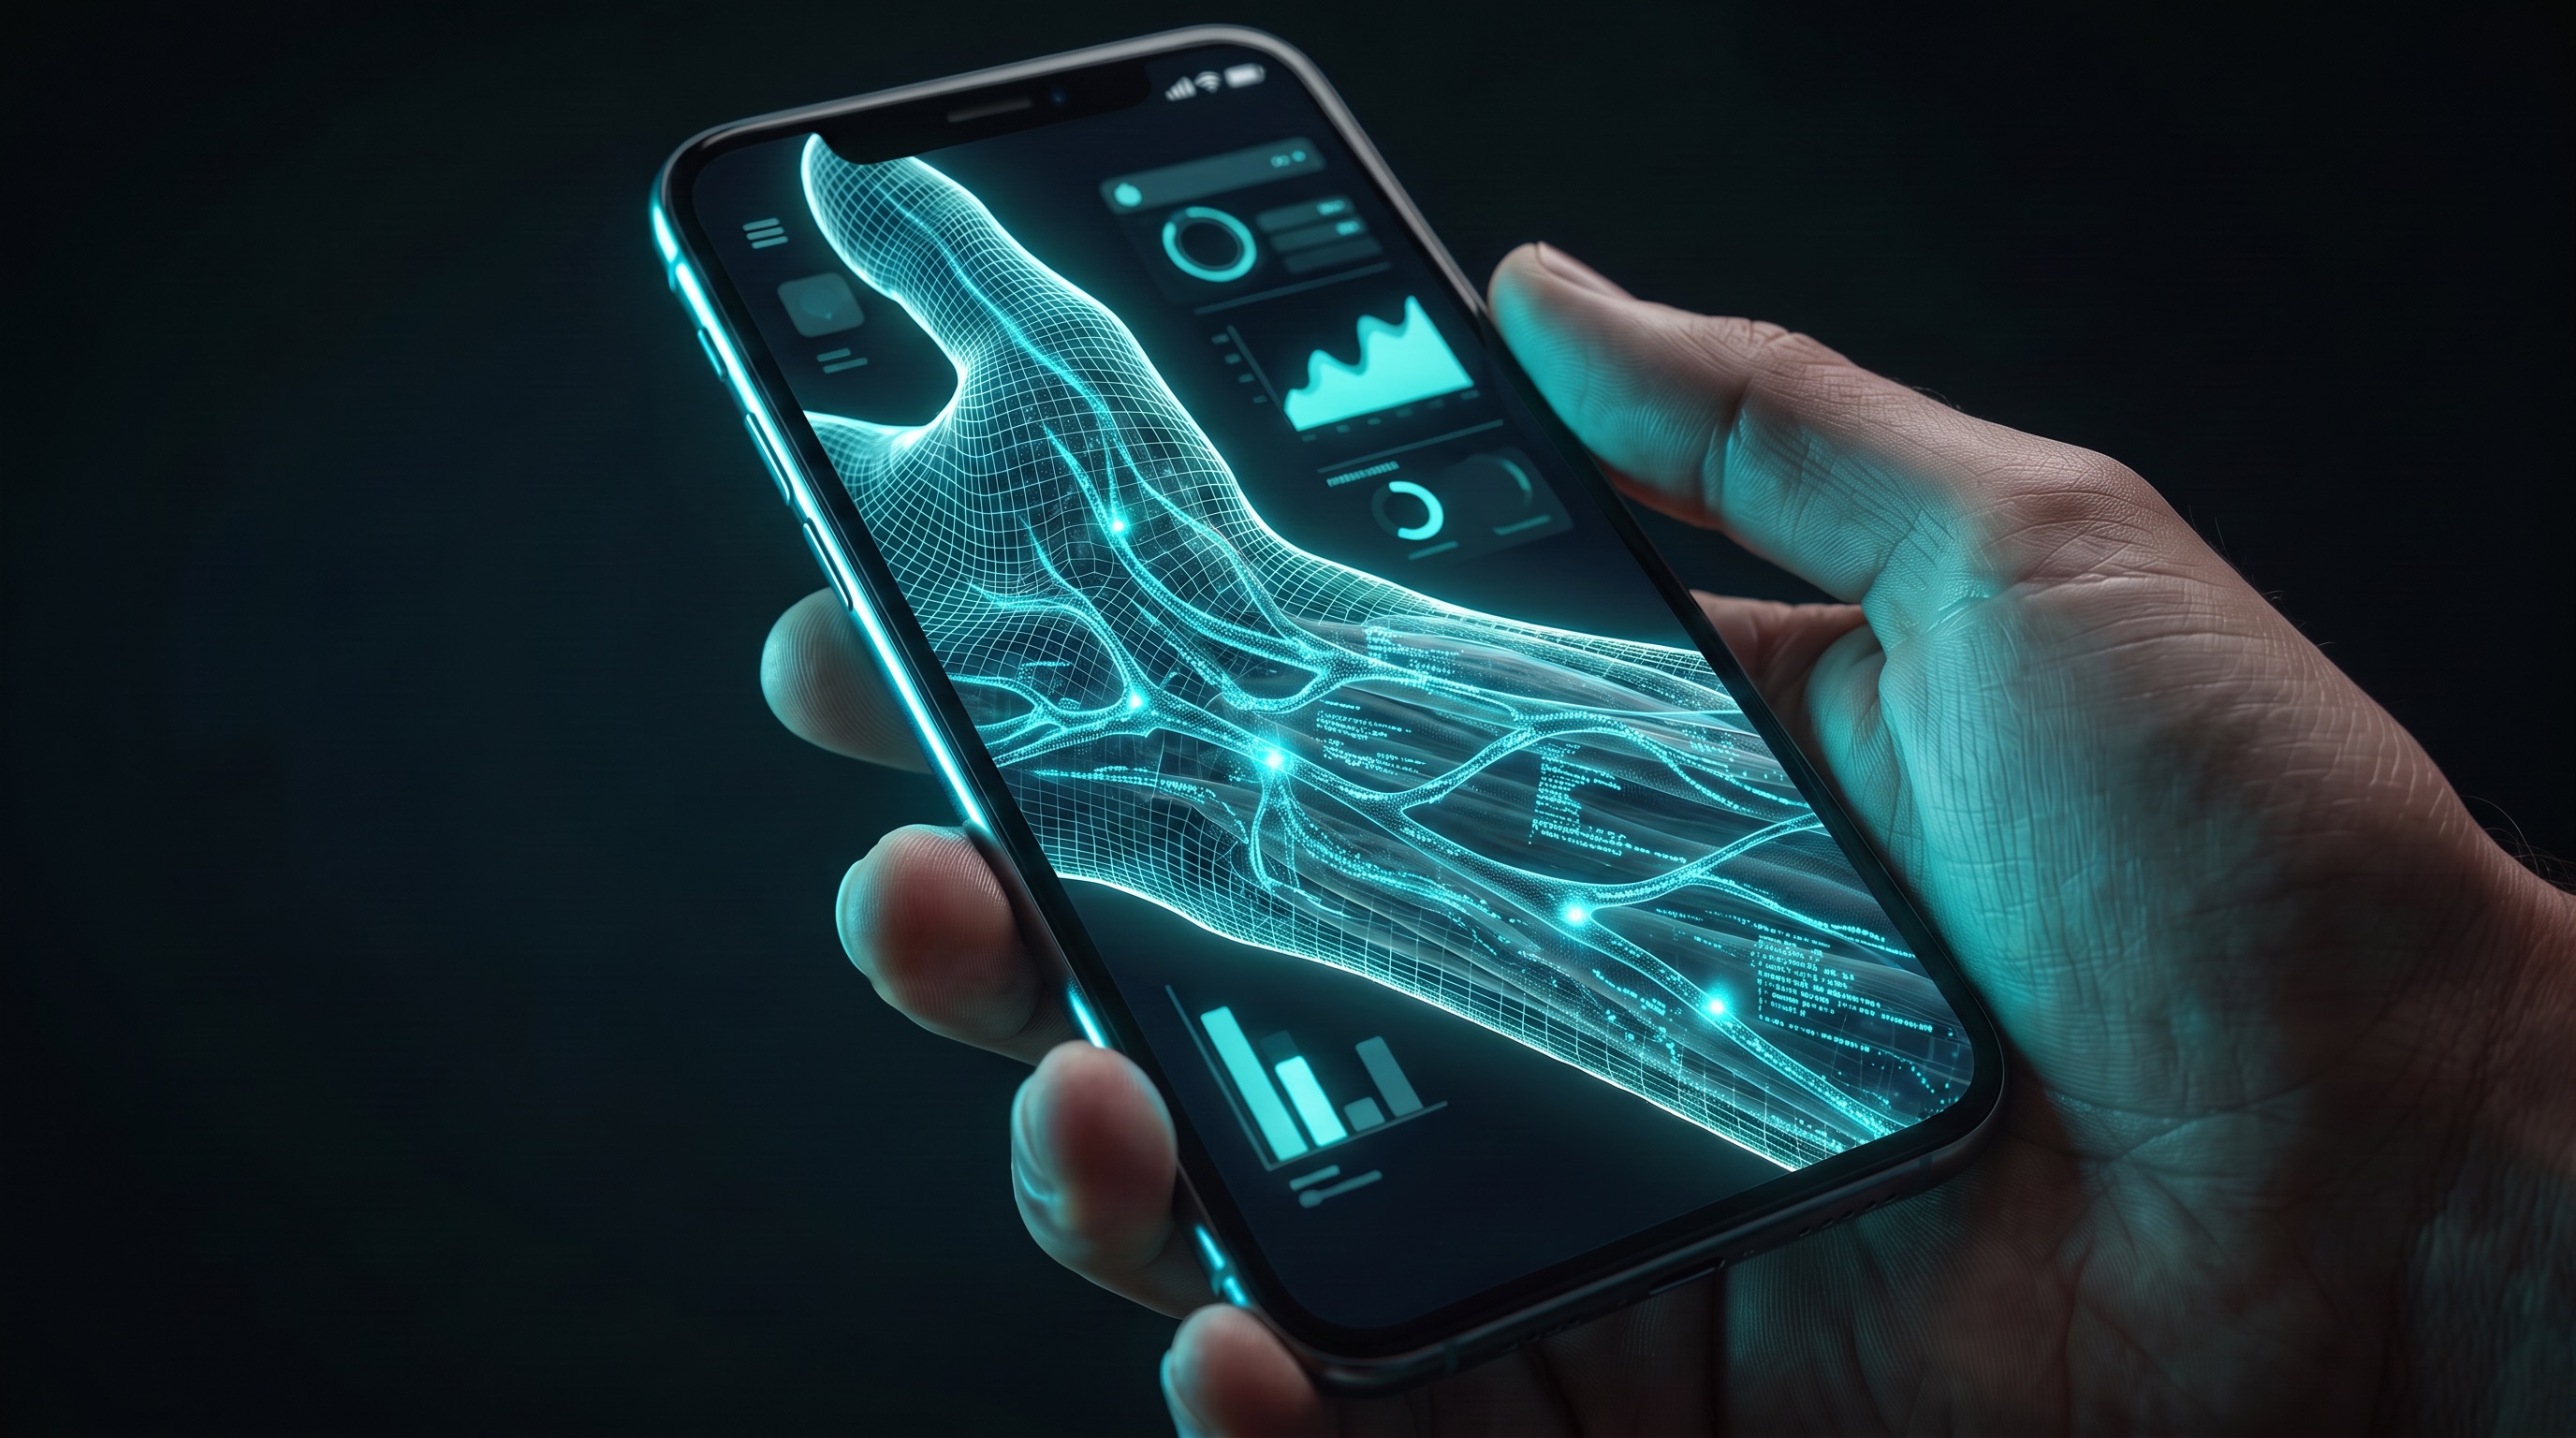
Code becomes a digital representation — from molecule to arm. Visible where you use it: on your devices. Demonstration with synthetic data.
Visualized representation
Deep diagnostics, clinically reviewed interpretation and a personal plan that evolves with you.
Illustrative display, no real data
The fluid front follows the tubing in a controlled way, without showing blood outside the system.
The EDTA tube fills from the bottom. An air space remains visible.
The camera approaches the sample calmly and prepares the transition into the microscopic layer.
At the electron microscope layer, color recedes. The cell surface and its form become traceable.
Hemoglobin and heme groups stand for measurable molecular relationships within the sample.
Molecular relationships become structured code — the basis for the Digital Health Twin from our sister brand Juvantis. The synthesis begins with synthetic data.
Code becomes a digital representation — from molecule to arm. Visible where you use it: on your devices. Demonstration with synthetic data.
Clinically reviewed and evidence-oriented. EU privacy law, continuous rather than one-off, personally supported.

A lab value is one measurement at one point in time. Without trend, symptoms, medication and the clinical question, its relevance remains unclear.

Wearable data provides approximations from daily life, such as sleep, pulse or activity. On its own, it does not explain cause and does not replace diagnostics.

A clinical letter summarizes one clinical excerpt. By itself, it rarely shows how load, routines and newer values interact.

Lifestyle describes routines, work, training, sleep and nutrition. Without measurement context, it remains unclear which lever fits the current situation.
Relevant data is collected in a structured way: intake, labs, measurements and daily signals. This creates a baseline that remains traceable.
Individual values are connected with domains, trend and context. Patterns become visible that separate reports can easily miss.
Interpretation separates orientation from medical relevance. Notable or uncertain points are marked for clinical review.
The interpretation becomes concrete next steps with dose, priority and limits. The plan stays cautious and checkable.
Follow-up measurements and feedback show what remains stable and where adjustment makes sense. One appointment becomes a health rhythm.

The health map organizes data by domain without turning them into isolated judgments.
Modules show which data categories may fit a context. Individual conclusions require personal diagnostics.
Baseline lab — A broad baseline profile for metabolism, inflammation, lipids and micronutrients.
Metabolic profile — Glucose, insulin and liver markers are connected with routines and body composition.
Cardiovascular — Lipids, blood pressure and capacity are interpreted with safety in mind.
Hormonal regulation — Hormonal axes are reviewed only with an appropriate question and clear boundaries.
Recovery and daily actions are presented with evidence level, limits and safety boundaries.
Red light & near infrared — Light applications are framed as complementary recovery support.
Cold & contrast — Temperature stimuli are planned with clear safety limits and supervision.
Active recovery — Low-dose movement is adapted to load and recovery.
Breathwork & relaxation — Simple routines support self-awareness and pause structure.
Sleep optimization — Light, timing, routine and data quality are organized step by step.
For a structured entry with baseline analysis and conversation.
For people who want trend and adjustment support over a year.
For closer support, prioritized scheduling logic and expanded diagnostics.
Clinical interpretation
Capacity & trend
Nutrition strategy
Recovery & routines
Data quality & portal
Coordination & support
clinically reviewed
clinically reviewed
clinically reviewed
Why trend, context and clinical interpretation say more than isolated snapshots.
What may be automated in the target state — and what explicitly may not.
Why cold, heat and light are meaningful only with fit review and safety boundaries.
For people who want a preventive, structured and clinically responsible view of their health.
The public website is information and request. Medical interpretation happens only within a suitable reviewed setting.
No. There is no live AI in the MVP. Target state: AI supports, medical responsibility stays with qualified people.
The consultation form collects only contact data and preferences. Please do not enter health data.
Notable findings belong in clinical review. The demonstrator shows synthetic examples only.
Many health questions become clearer through trend, implementation and adjustment than a single appointment.
Begin with a conversation. Non-binding, clinically grounded, unhurried.